With so much attention being paid to zero-click search in this new era of AI, we thought it might be helpful to dig a little deeper into how individuals are consuming content online. The statistics below have been compiled from a number of sources, including data from HubSpot, MailChimp, and other providers, but regardless of source they tell a similar story.
Traditional impression volumes are falling, and reach is becoming harder to come by.
We are seeing two trends at work:
- Growing challenges to organic-centric campaigns caused by AI search and algorithm prioritization of paid content
- (Re)fragmentation of the digital media landscape into more niche personality/content-specific channels
Here’s the data behind those trends.
Search Content Consumption
We’ve covered the zero-click search era’s impact on marketing before. The bottom line is that organic search traffic is declining, and this trend will continue as AI-driven search rises in popularity. Just how popular is AI search? According to a recent ChatGTP usage research paper:
– ChatGPT is serving 2.6 billion messages a day as of June 2025. Google was serving ~13.7 billion searches as of Jan 2025.
– ChatGPT categorizes almost a quarter (24.4%) of those messages as “information seeking” (meaning people using it like a search engine)
So, with the caveat that this data is ONLY from consumer plans, we could assume that ChatGPT already owns anywhere from 5-19% of the current search market.
With that in mind, here’s the latest data on how many searchers you can expect to reach the end of your posted content.
The percent of searchers who…
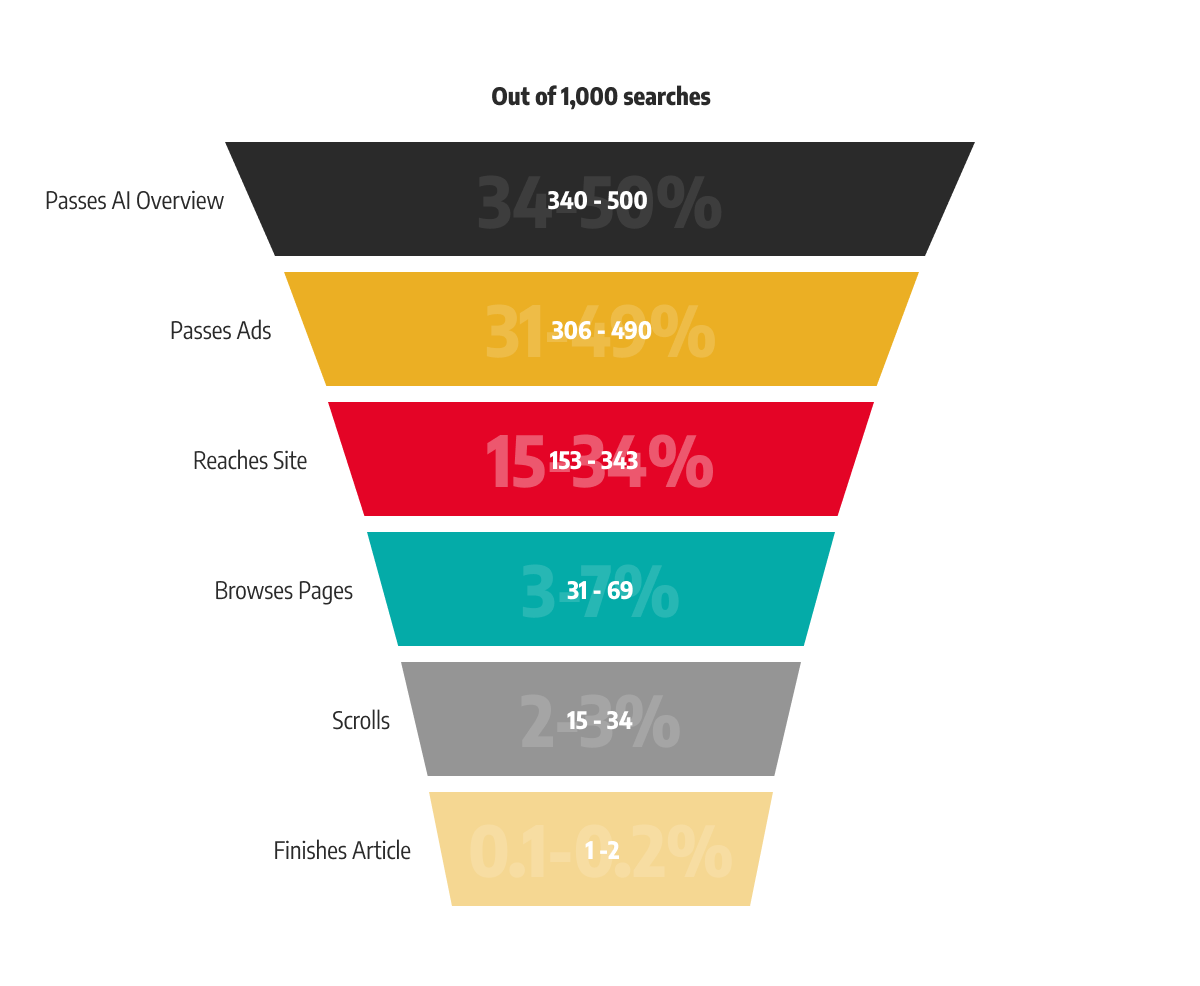
- …consume an AI overview & don’t go any further: 50-66%
- …click a sponsored link: 2-10%
- …click an organic link but bounce from the page: 30-50%
- …read some content on your site: ~20%
- …scroll down a page: ~50%
- …reach the end of an article: ~5%
Let’s put those numbers into perspective using a sample of 1,000 searches, with right being our high-end and left being our low-end estimates.

What does this mean for a marketer? It means you’re no longer writing for web traffic, you’re writing to answer questions on a third party site.
Best Practices for GEO and SEO
1. Write for discovery first (provide concise answers, then depth)
- Provide straightforward answers to common questions, then provide context and detail
- Make headlines super specific (write for robots)
- Keep headlines within 60 characters
- Keep AI/LLM “nodes” in mind
These models produce responses based on the next most likely token, and the way those models come to those conclusions is to parse vast volumes of content. When they do, they boil that content down into related nodes. For example, Bad Bunny will perform at the 2026 Super Bowl halftime show. An LLM could parse this information into a few categories: pets (bunnies), dishes (bowls), concerts (perform), etc. But usage in context allows it to make more accurate predictions. Your LLM will understand “Bad Bunny” is not a misbehaving pet if it sees the usage in context with musician or performer enough times.
The same rule applies for your answers – keep hammering home the “nodes” you need to reinforce in your content.
2. Demonstrate credibility
Google’s GEO guidance still tells creators to prioritize the EAT model: Experience, Expertise, Authoritativeness, Trustworthiness. In our experience, what that means is that you’ll want to present statistics, visuals, and links to reputable sources along with your content. You want to be researched, not regurgitated.
Google’s EAT model stands: Experience, Expertise, Authoritativeness, Trustworthiness
3. Onsite
As always, Google prioritizes for load time, and other crawlers are looking for clean structured data. Format your content for fast load times, and your meta data for bots.
Email Consumption
Email measurement is getting notoriously difficult as clients restrict what data they share and automated click security tools throw click data out of whack. Here are some rough current benchmarks:
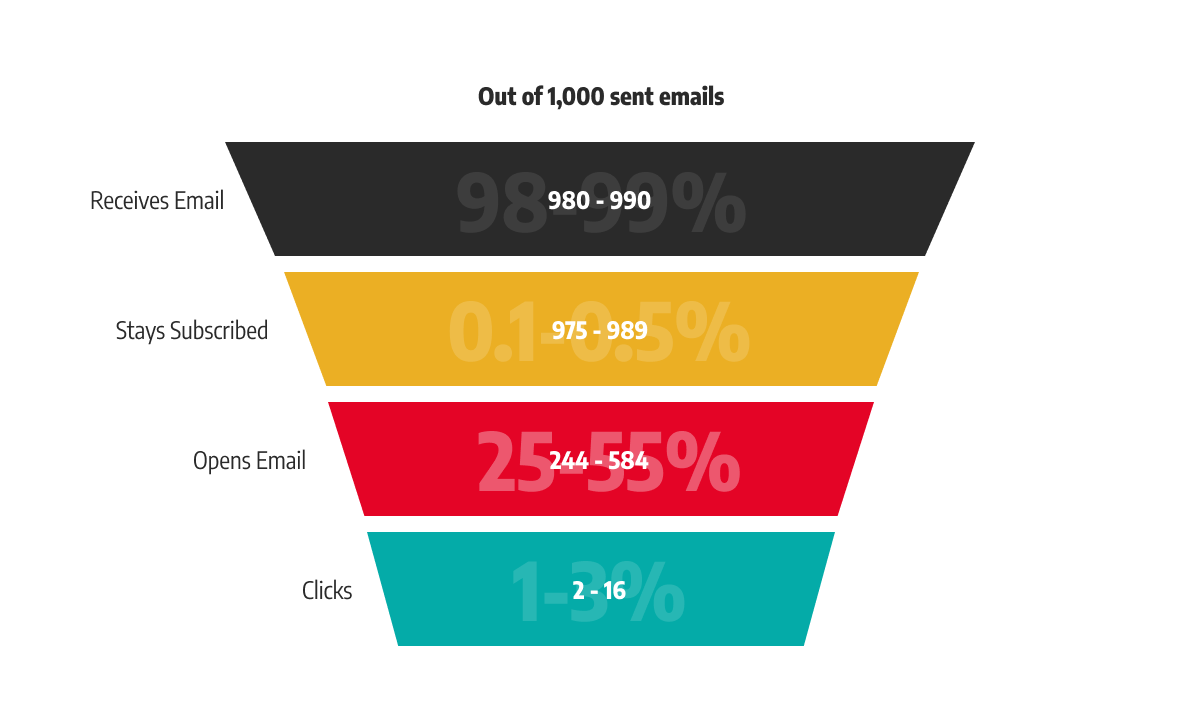
- Emails Delivered: 98%
- Unsubscribe Rates: 0.1-0.5%
- Open Rates: 25-55%
- Click Rates: 1-3%
What does that look like visually?

Of course, email performance fluctuates widely based on audience, date/time of send, etc. But if you need to boost your performance, here’s what you can do.
Best practices for improving email performance
- Think mobile-first – keep subjects short and punchy, with the attention-getters in the first 33 characters
- Show value to recipient first. Your CTA should come second
- Send time, domain reputation/configuration, and list segmentation/hygiene are critical
- Use graphics sparingly
- Understand that metrics will be approximate
- Test and measure with every send
Social Media Content Benchmarks
Finally, we come to social media, where engagement rates are falling as providers try to increase revenue every way they can and more users turn away from declining experiences.
- Organic impressions: declined by ~62% since 2023
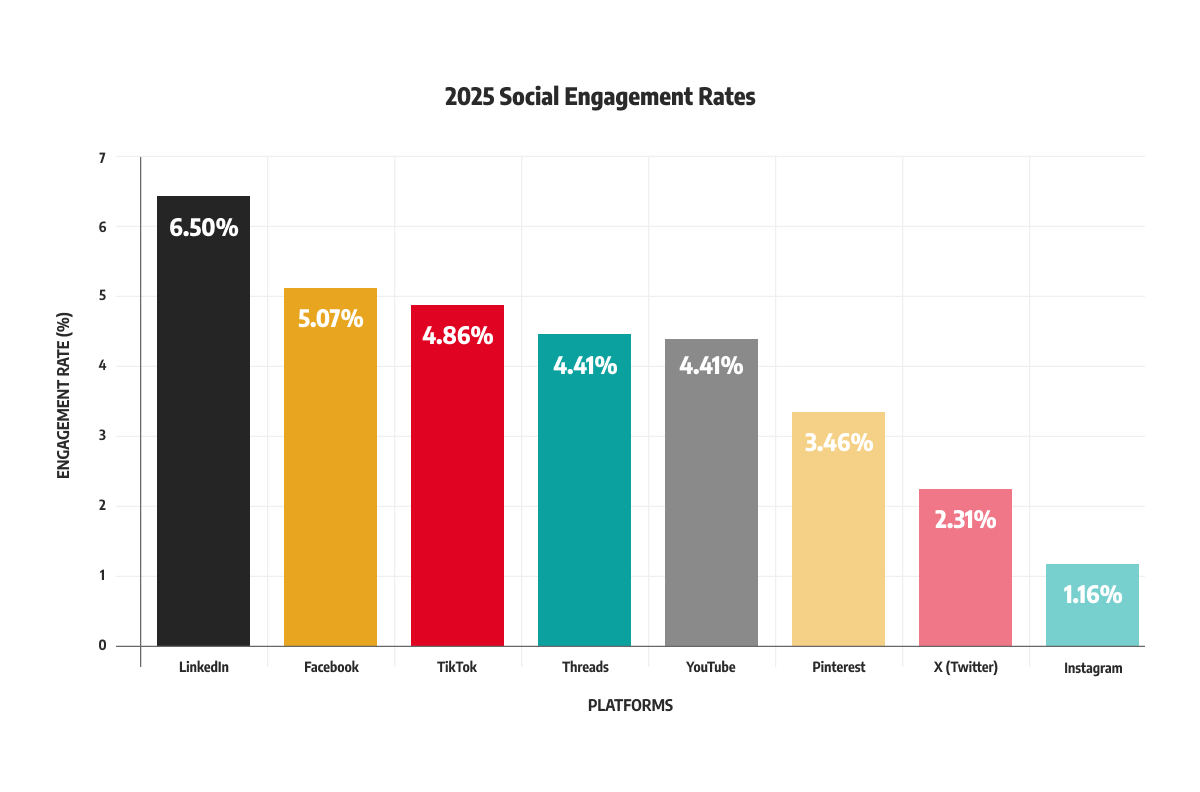
- Engagement rates: falling outside of LinkedIn and TikTok
- Images (in carousel) and video: drive more engagement
- Inbound traffic: falling. Platforms are encouraging users to remain on the site (with forms, content, etc.)
Below are some social engagement benchmarks for different channels as of this writing.

Best Practices for Social Media
- Post early in the day (to maximize engagement when people are scrolling with their first cup of coffee)
- Encourage sharing through tagging and internal team engagement
- Use images and videos to generate more engagement, but be wary of video engagement. Auto-play videos will skew viewership data.
When thinking about post length, keep your headlines to 5 words (all you can count on for mobile screen sizes). The ideal post length varies significantly by platform – longer LinkedIn posts perform better, while TikTok copy should be kept as short as possible.
When you post videos, put everything you want to communicate in the first 5 seconds before the viewer can skip your ad, and make sure to include subtitles
For more, you can check out social data from Buffer, Hootsuite, and Sprout Social.
So What’s Next?
In the current content environment, we recommend the following approach:
- Build and nurture your list and followers – it will get harder to find new names, so make sure to leverage the ones you have
- Lean into paid third-party and advertising channels like review sites, YouTube ads, and influencers as much as you can – they control the audiences now
- If you have limited resources, it’s better to go all-in on one channel than trying to be present in all places
And of course, if you ever need help, just ask us!
Share this post on your social profile:
A performance-driven marketing strategist with twenty years of experience growing international brands and organizations, Tim Young spent time at the Corporate Executive Board (now Gartner) and the Entrepreneurs' Organization before founding Young Marketing Consulting in 2013.
His areas of expertise include brand growth and identity development; lead generation and conversion; search engine optimization (SEO); customer satisfaction evaluation and improvement; customer segmentation and CRM work; ROI analysis and improvement; market research; and product development.
Want to get our blogs directly to your inbox?
Enter your email to sign up for our point of view on marketing trends, brand strategy, and sustainable business.


